
Cobbs Creek
25people hurt · past year
23 fewer than the year before (48)
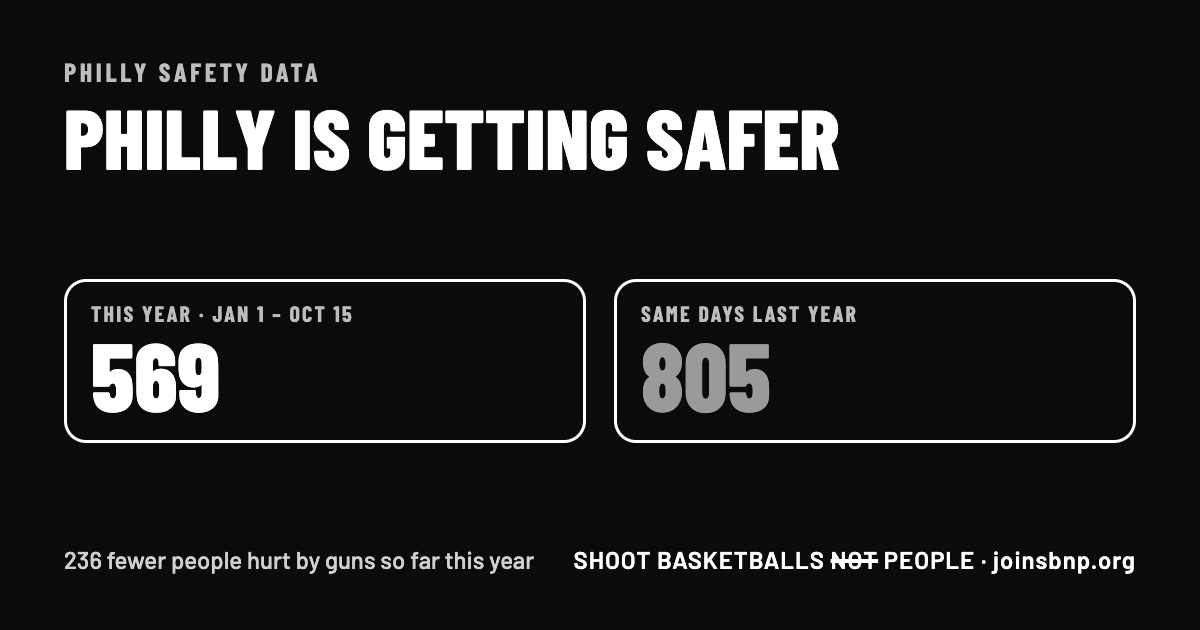
Fewer people are being hurt by guns this year. Here is this year so far, next to the same days last year.
This page talks about gun violence. Take your time, and read it with a grown-up if you'd like.
236 fewer people hurt
The city adds new numbers every day. Newest day in the list: October 15, 2026.
Share the good newsBehind every number on this page is a real person: someone's child, parent, friend or neighbor. Each one has a name, a story and people who love them.
Most people who are hurt by a gun get better, with help from doctors, nurses and the people who care about them. Sadly, about 1 out of every 5 lost their life. Their families and friends miss them every day.
The good news: fewer people are being hurt this year. That means more families are safe together.
If these numbers make you feel sad, worried or confused, that's okay. Those feelings are normal, and you can always talk about them with a grown-up you trust.
Each line adds up the people hurt, month by month. The lower the line, the fewer people hurt.
This year's line is lower. That means fewer people hurt.
| Month | 2026 | 2025 |
|---|---|---|
| January | 34 | 70 |
| February | 66 | 146 |
| March | 114 | 218 |
| April | 167 | 294 |
| May | 258 | 419 |
| June | 334 | 506 |
| July | 404 | 634 |
| August | 486 | 713 |
| September | 541 | 771 |
| October (through the 15th) | 569 | 805 |
| November | — | 898 |
| December | — | 955 |
That's 1,770 fewer people hurt than in 2021, the hardest year. 2026 isn't over yet, so this number will still grow a little.
| Year | People hurt | Under 18 | Lost their life |
|---|---|---|---|
| 2015 | 1,294 | 81 | 233 |
| 2016 | 1,342 | 99 | 262 |
| 2017 | 1,263 | 95 | 259 |
| 2018 | 1,450 | 119 | 302 |
| 2019 | 1,473 | 118 | 311 |
| 2020 | 2,260 | 197 | 449 |
| 2021 | 2,339 | 212 | 507 |
| 2022 | 2,270 | 217 | 476 |
| 2023 | 1,673 | 161 | 376 |
| 2024 | 1,111 | 130 | 228 |
| 2025 | 955 | 113 | 209 |
| 2026 so far | 569 | 46 | 118 |
Each figure stands for one person hurt on an average day.
That's 4 fewer people and families hurting every single day.
A classroom has about 25 kids. Each box below is one classroom. Each dot is a kid or teen, under 18, who was hurt by a gun in 2026 so far. Tap a year above to change it.
46 kids and teens. That's about 2 classrooms.
Every one of them deserves to feel safe at home, at school and on the court. That's why SBNP does what we do.
SBNP coaches and mentors kids in these neighborhoods. Here's how many people were hurt by a gun in each one in the past year, next to the year before.
23 fewer than the year before (48)
4 fewer than the year before (25)
11 fewer than the year before (28)
2 more than the year before (4)
Small numbers move around a lot from year to year, so one year is not a trend.
69 of the 712 people hurt in the whole city in the past year were in these four neighborhoods: about 1 in 10.
Germantown adds up the six areas on the city's map with Germantown in their name. Mt. Airy adds up East and West. The city adds new numbers every day. Newest day in the list: October 15, 2026.
Strawberry Mansion: 5 fewer people hurt than the year before.
In 64 of Philly's 159 neighborhoods, no one was hurt by a gun in the past year.
A darker color doesn't make a neighborhood a bad place. Every neighborhood is full of families, coaches, teachers and neighbors who care about it and work to keep it safe.
In 2025, Philly had its fewest homicides since 1966, according to Pew. The city has come a long way from its hardest years.
So far this year, 136 people in Philly lost their lives to homicide (from any cause, not only guns), compared with 179 on the same days last year.
Gun violence can be prevented. Careful studies have found things that really help:
In Chicago, teens who joined “Becoming a Man”, with small talk-it-out groups and, at first, sports, were arrested for violence about half as often.
Source: University of Chicago Crime LabIn Chicago, teens who were offered a summer job had 43% fewer arrests for violence in the months that followed.
Source: Science, 2014Right here in Philly, cleaning up and planting empty lots went along with fewer gun assaults near those lots.
Source: Penn and Columbia, 2018City programs like the Community Crisis Intervention Program hire people from the same neighborhoods to reach out to those most at risk and help them find another path.
Source: Office of Violence PreventionWhen a bullet from a gun injures someone. Doctors and nurses help most people get better. Sadly, some people don't survive.
Someone who was hurt and got better. Many survivors go on to help others heal.
From January 1 up to the newest day in the city's list. We compare it to the same days last year so it is fair.
From September 1, when school starts. We compare it to the same days of last school year.
Kids and teens. Anyone who is 17 years old or younger.
A part of the city with its own name, like Strawberry Mansion or Kingsessing. Philly has 159 of them.
Every number on this page is a reason we show up. SBNP gives Philly kids a safe place to play, learn and grow, with coaches and teammates who have their back. Hurting fewer people is possible, and together we can keep these numbers going down.
It's okay to feel sad, scared or upset after reading this. You are not alone. Talk to a parent, teacher, coach or another grown-up you trust. They want to help. If you are ever in danger, call 911.
Use this page to start a conversation. Listen first, answer honestly without extra detail, and remind kids that many grown-ups are working to keep them safe.
A deeper look for grown-ups: six patterns in the data →The Philadelphia Police Department counts every person hurt by a gun in the city. The City of Philadelphia shares that list on OpenDataPhilly and updates it every day. This page checks the list for new numbers every few hours. We share totals only: each person's story belongs to them and their family.
The count includes people hurt in shootings involving police (174 since 2015, less than 1 out of 100). Neighborhood lines, rec centers and courts come from OpenDataPhilly; population from the U.S. Census Bureau. Numbers can change a little when the city corrects its list.